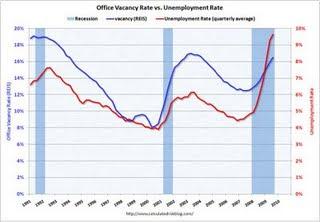
 The 18 month lag between Residential & Commercial properties appear in tack this cycle. “If” the residential prices are near the bottom, then commercial ought to bottom next fall. Where might prices be then?
Rents
Locally, office rents dropped sharply during the 3rd quarter. Cushman & Wakefield recently stated: “In downtown Bellevue, leases slid from $38.11 per square foot per year in the second quarter to $35.25. In downtown Seattle, they dropped from $33.23 to $31.90.” (http://seattletimes.nwsource.com/html/businesstechnology/2010001514_office05.html ). That’s 16% annualized in Bellevue, and, over 30% in Seattle. A continued drop in rents is baked in the cake. For example, Northwest Mutual’s purchase of the WAMU tower gives them a lot of space to rent, and a significant cost advantage. Undoubtedly they will offer lower rents that meet their target returns, but kill the whole market driving rents down.
A large nationwide CRE holder, Liberty Property Trust reported that: “For the third quarter rents decreased by 13.9%. We expect this third quarter experience to repeat itself for the balance of 2009 and for 2010. We are projecting that rents for 2010 will decrease by 10 to 15% on a straightline basis.” That would put rent decreases near 25% from their peak.
 Nationwide Office vacancy rates are over 16%, after bottoming at 8%. Office vacancies appear to lag unemployment pretty closely. A top in unemployment will be a good confirmation of a coming low in office vacancies. The sharp increase in unemployment ensures that current leaseholders have ample room to house new employees prior to needing additional space, diminishing demand for office space.
Puget Sound vacancies are tracking the nationwide market.


Strip mall vacancies have no where to go but up. Take a quick drive thru your favorite strip mall and decide if 10% vacant is adequate.
Cap Rates

Liberty Property Trust disclosed recent cap rates on actual sold office properties: “The cap rate on these sales will be in the 9 to 11% range.” These sales were negotiated early in the year. Do you think your local lender would be willing to lend based on a 10% cap rate, given their own problems? Not a chance, unless you have pile of money to put down at closing.
So where should CRE prices end up next year? Rents dropped precipitously during the 3rd quarter. Drops from peak pricing will be 20%. Vacancies haven’t seen a bottom yet, but so far have increased from about 7% to 16% in the Puget Sound. 20% vacancies will hit early next year. Capitalization rates have increased from 7% to at least 10%. Where does that leave prices?
Rental Rate 100% 80%
Vacancy Rate 7% 20%
Capitalization Rate 7% 10%
Operating Income $70,000 $47,600
Capitalized Value $1,000,000 $476,000
Ouch! A 50% haircut from the peak, even with generous assumptions. It is unlikely a stretched investor would be willing to accept a 50% haircut, since the LTV on the project was closer to 65%. How can they repay the loan? Rather, a short list of banks would probably be ecstatic to take the haircut on their loan, get some cash and help get the regulators off their backs.


