Monday, November 2, 2009

Banks putting the squeeze on Developers

Here’s a round up of recent articles discussing properties heading into foreclosure:

Banks foreclosing on Whatcom County's unsold condo projects
http://www.thenewstribune.com/news/northwest/story/927549.html

Chapter 11 for Cascadia
http://www.thenewstribune.com/topstories/story/919317.html

Seattle developer Mastro has huge debts, bankruptcy papers show
http://seattletimes.nwsource.com/html/localnews/2009843640_mastro11.html?prmid=obnetwork

Frontier Bank sues Edmonds developer over $40 million in unpaid loans
http://www.heraldnet.com/article/20091016/BIZ/710169861

The following Banks were mentioned in the articles:

Horizon Bank
Bank of the Pacific
Whidbey Island Bank
Seattle Bank
Columbia State Bank
First Sound Bank
Venture Bank
HomeStreet Bank
Frontier Bank


Guess what many of these banks have in common?
Check the Troubled Bank List at Calculated Risk.
http://www.calculatedriskblog.com/2009/10/unofficial-problem-bank-list-grows-to.html
Regulators are putting the screws to many of the Banks pressing foreclosure.

Horizon Bank _______3/3/09 _____Cease & Desist
Bank of the Pacific
Whidbey Island Bank
Seattle Bank ________6/08/09 ____Cease & Desist
Columbia State Bank
First Sound Bank
Venture Bank _______9/11/09 _____Failed
HomeStreet Bank ____5/08/09 _____Cease & Desist
Frontier Bank _______3/20/09 ____Cease & Desist


I imagine they would also fit the classic definition of “motivated sellers.”

Saturday, October 31, 2009

CRE Prices

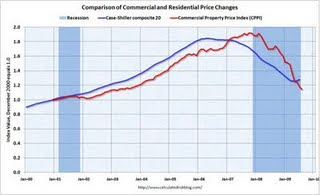
The 18 month lag between Residential & Commercial properties appear in tack this cycle. “If” the residential prices are near the bottom, then commercial ought to bottom next fall. Where might prices be then?

Rents

Locally, office rents dropped sharply during the 3rd quarter. Cushman & Wakefield recently stated: “In downtown Bellevue, leases slid from $38.11 per square foot per year in the second quarter to $35.25. In downtown Seattle, they dropped from $33.23 to $31.90.” (http://seattletimes.nwsource.com/html/businesstechnology/2010001514_office05.html ). That’s 16% annualized in Bellevue, and, over 30% in Seattle. A continued drop in rents is baked in the cake. For example, Northwest Mutual’s purchase of the WAMU tower gives them a lot of space to rent, and a significant cost advantage. Undoubtedly they will offer lower rents that meet their target returns, but kill the whole market driving rents down.
A large nationwide CRE holder, Liberty Property Trust reported that: “For the third quarter rents decreased by 13.9%. We expect this third quarter experience to repeat itself for the balance of 2009 and for 2010. We are projecting that rents for 2010 will decrease by 10 to 15% on a straightline basis.” That would put rent decreases near 25% from their peak.
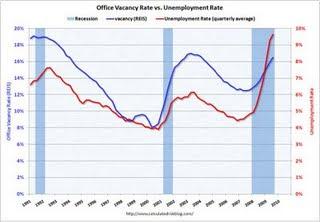
Nationwide Office vacancy rates are over 16%, after bottoming at 8%. Office vacancies appear to lag unemployment pretty closely. A top in unemployment will be a good confirmation of a coming low in office vacancies. The sharp increase in unemployment ensures that current leaseholders have ample room to house new employees prior to needing additional space, diminishing demand for office space.
Puget Sound vacancies are tracking the nationwide market.


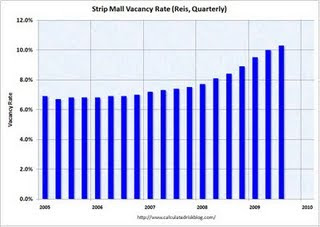
Strip mall vacancies have no where to go but up. Take a quick drive thru your favorite strip mall and decide if 10% vacant is adequate.

Cap Rates

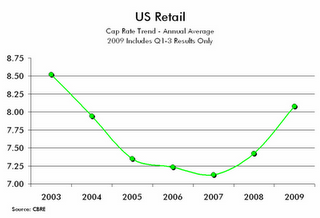
Liberty Property Trust disclosed recent cap rates on actual sold office properties: “The cap rate on these sales will be in the 9 to 11% range.” These sales were negotiated early in the year. Do you think your local lender would be willing to lend based on a 10% cap rate, given their own problems? Not a chance, unless you have pile of money to put down at closing.

So where should CRE prices end up next year? Rents dropped precipitously during the 3rd quarter. Drops from peak pricing will be 20%. Vacancies haven’t seen a bottom yet, but so far have increased from about 7% to 16% in the Puget Sound. 20% vacancies will hit early next year. Capitalization rates have increased from 7% to at least 10%. Where does that leave prices?

Rental Rate 100% 80%
Vacancy Rate 7% 20%
Capitalization Rate 7% 10%
Operating Income $70,000 $47,600
Capitalized Value $1,000,000 $476,000

Ouch! A 50% haircut from the peak, even with generous assumptions. It is unlikely a stretched investor would be willing to accept a 50% haircut, since the LTV on the project was closer to 65%. How can they repay the loan? Rather, a short list of banks would probably be ecstatic to take the haircut on their loan, get some cash and help get the regulators off their backs.


Naz 10-09

After a very volatile week, the Nasdaq ended up falling out of its wedge. It was turned back at its gap and failed to meet the original target.


The indicators are rolling over pressuring price. 2150 (which would be a gift) would be a great area to short, with stops at 2185.

Thursday, October 29, 2009

US Dollar

The dollar got close to its target and is now breaking thru its trendling. The indicators are turning up and volume has been quite robust this week. This doesn't bode well for equities nor commodities. UUP looks pretty attractive here with stops below the trendline.


Also, the Euro hit its target.


SP 500

Looks like resistance at the wedge to resistance is going to be too difficult to jump. Price was turned back at the trendline and is starting to fall out of the wedge. The indicators are rolling over with plenty of room to the downside.

This looks like a good place to sell. Shorting at 1060 with stops near 1075-1080 ought to work.

Monday, October 19, 2009

S&P 10/09

The S&P 500 is at a critical junction after its recent runup since this prior post:


It looks like the S&P is going to need to jump the 1080-1100 area in order to hit the original target. Bullish earnings reports this week may provide the catalyst. If it doesn't make the jump soon, the rising wedge may rule the day, taking prices down quickly.

Saturday, October 17, 2009

NAZ Long Term

The Nasdaq is nearing it's target: http://rpbsinvsvcs.blogspot.com/2009/08/naz-long-term.html

Nearing the top of a wedge near the target area. It's going to need to make a jump in the next week or so for the target to get hit. It will probably take some robust earning to get it over the bar.

Gold

Gold has broken out of the long term inverse head & shoulders identified here: http://rpbsinvsvcs.blogspot.com/2009/08/gold-update.html and has hit its first target of 1050. The next buy point is a backtest of the breakout at 1010. Stops are back in the basing area below 1000.


Long term holders should hold. This has a long ways to go.


Saturday, September 5, 2009

Dow Short Term

It would be nice to see a retrace towards 9400 allowing stops at 9375. Not clear whether that opportunity presents itself. Target is at 9535. If the target is hit, the possibility of new highs increases.

Lumber Update

After the breakdown, looks like a bascktest of 178 is order. Stops at 180.25. 160 should be the bottom for lumber.

China

DCon't count China out quite yet. Shanghai is testing important levels with a confluence of support at the moving averages, downtrend backtest and a short term trendline. A conservative buy level is at 2700. The stop would be 2600. A test of the recent highs would be a minimum target.

5 Year Treasuries

It's make or break time for the 5 Year Note. It traded below its 20ma and 50ma this week. It's going to need to get above 2.4% in a hurry to keep wave 4 favorable. A further backtest to the breakout will unfavorably weaken wave 5's target.

Gold - Long Term

Gold is making the move. The Indicators are showing more room for this move. We should see new highs in the coming weeks. After the breakout, stops should be moved to just below the breakout.

NAZ Long Term

Backtesting the breakout. Indicators are getting overbought. A sustained breakout might be more sustainable if the backtest takes it down to 1900. Unfortunately that's quite a ways from today's close.

Saturday, August 29, 2009

Lumber

Critical juncture for Lumber. After two failed attempt to break its longer term downtrend, Lumber is back knocking on the uptrend of its fledgling 2009 rally.
Oops! Not looking good for lumber here. Taking a closer look it appears 178 will be tough resistance to break thru. A short would put a stop in at 182 while looking for a target of 150 setting up a longer term double bottom. Appears lumber traders think new home starts won't pick up until Spring 2010. They're probably correct on that count.


Used Home Inventories July '09

The seasonal inventory build is underway. It's going to be hard to get much pricing traction with inventory still too high. Any strength is going to be met by higher listings sapping pricing power.

Used Home Sales July '09

After stablizing, used home sales are actually picking up. Desperate sellers and eager investors/1st time buyers are providing some much needed liquidity to the marketplace. Appears sales volumes won't much below 3,500,000. This is great news for transaction based market players who downsized during the downturn. Escrow, title insurers, agents and low end builders should be looking at strategies to increase their market share.

Case Shiller Prices June '09

Prices aren't dropping as fast as they were. Investors and 1st time buyers are providing a much needed floor on low end prices. Investors may have deep pockets and continue to support the market. 1st time buyer pent up demand will wane as the tax credit expires. Builders and their lenders desparately need prices to stop dropping in order to curb their losses. Low end builders may be nearing this point. High end builders will continue to bleed. Take your losses this year in order to be competitive in the marketplace.
Ugh. Deduct closing costs and the average is back at 2002 prices. Tough spot for any high LTV buyer or refi'er to be in. Each uptick in pricing is going to be met with new listings from those high LTV'ers who've found an acceptable price point to unload their home. There will be no "V" shaped price recovery. Hockey stick to come.


Nationwide New Home Inventory 709

The inventory liquidation continues. New home inventories have been halved during 2009. Difficulty in financing standing inventory is going to continue to pressure inventory levels. Getting down to 200,000 would be supportive to pricing.

Even with the a halving of inventory levels, months supply is still too high for the current environment. Months supply needs to backoff to 5 before pricing can firm up. August thru mid-October sales will tell the tale.

Nationwide New Home Sales July '09


chart from http://www.calculatedriskblog.com/

Spurred by the tax credit, low mortgage rates and lender pressure on builders, nationwide new home sales showed some seasonal strength improving over June. Still, it's the 3rd slowest July sales since 1963. With the tax credit expiring at the end of November, new home sales (& used home sales) should show relative strength thru mid October. Builders would be well served to use the opportunity to further liquidate inventories. With nearly 1 in 10 workers unemployed and 1st time buyer pent up demand being used up, the future is not so clear.

Dr Copper


Frequently touted as a key economic indicator of the health of the economy, Dr Copper has been on an absolute tear in 2009. More than doubling! If Copper is indeed a forward looking prognosticator, take a look at whatelse shows a similar potential Cup & Handle.

Oil recently tagged its 50ma and is looking to jump its neckline. Tight risk/reward with stops below the 50.


Sunday, August 23, 2009

QQQQ Daily

Looks like a breakout. Stops below 39.4 look impregnable.

SPX Weekly


Not much resistance until 1100. That's a nice 10% move. A break below 957 changes things, but looks highly unlikely until 1100 is reached.

SP500 Daily

Hard to call this anything but a breakout. Indicators all moving North. Volume is reasonable. Stop below breakout.

NAZ Long Term


Breaking out! Indicators are extended which is to be expected. Target is indicated.

Yen


Looking heavy here. 100 is calling. A break below 104.50 confirms the move. A weak Yen typically helps equities.

Euro


The Euro is making the move. This bodes well for equities, metals and commodities. Buy at 142. Stop at 141.

Oil - Long Term


Bummer! Looks like Oil is headed higher. A break above 74 opens the door to $100 a barrel. First target is near $82. A close stop after the breakout is 73.

Gold Update

Good setup here. Possible 5 wave triangle correction in the 4th wave. Could be explosive. 935 would be a great buy, with stops at 933 (904 is a stop for investors). If the triangle works, 1150 could be reached shortly.

5 Year Treasuries


As long as the 5 yr Note holds it's trendline, 5 yr rates should move higher. Great stop opportunity at 23.95. Targets 34.

Wednesday, August 12, 2009

S&P 8-12-09


Could it be a H&S? Nobody is going to believe it after last month's H&S fiasco. SPX is heading to 980, which aligns with the 20ma on the daily. Stops at 1000.

Update 8-22-09. 980 on 8-17-09. Gone Long.

NAZ 8-12-09


The Naz looks headed for 1950. Stop at 1978. Hopefully will be able to get in the position after the 60s indicators rebound a bit.
Update 8-23-09. Made it to 1930 on 8-18-09. Making the move higher.

Tuesday, August 11, 2009

Currencies - Long Term

Can the Euro breakout? 140 is a pretty good stop with a target of 150.


The Yen looks vulnerable. A close stop would be at 105. Targets 100. A measured move would get it closer to the 200 near 95.

S&P - Long Term


There's not much reason the S&P doesn't go to 1,225. Looks like a backtest maybe required first. Stop is at 950. 1st target is at the down trendline, 1,140.


Gold - Long Term


Gold looks headed for a break out. Nice trend line support with a potential inverse head & shoulders. Stop is at 932, below the trendline and the 20. First target is $1,000. If Gold breaks out, it targets $1,150.
Welcome to my Blog.