Saturday, April 30, 2011

Case Shiller - 10 & 20 City Composites

February's CS indices were released this week.  It appears that prices are finally starting to drop again.
 Volumes have dried up over the last year due to stagnant prices.  Last year's tax credits have only served to drag out the process.  Prices need to drop before a meaningful bottom can be found.
 The rate of change dropped below negative at the beginning of the year. 
On a fundamental basis, prices may not need to go too much lower.  Price to rent will hit the long term average at 1.0, not far from here.  To get there, home prices need to drop a bit further as rental rates creep higher.

Case Shiller - Seattle

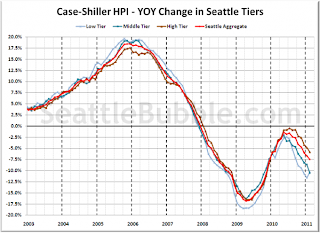
The February Case Shiller Home Price Indices were released this week.  Seattle didn't fare too well.
 Prices have fallen back to 2004 levels. 
 While the nationwide index has held fairly firm, Seattle prices resumed their downturn last Summer.  Particularly the lower priced homes.  I'd suggest this is due to lenders taking a more aggressive stance towards reducing their exposure to Real Estate. 
The lower priced homes have lost 13% since last June.  The high end has been spared tad.  However, it is worth pointing out, that home prices have not since any appreciation since the end of 2007. 

In order for any real estate market to recover, prices need to move to the point where the clear the market.  In that sense, Seattle's market is trying to recover by finding the clearing price.  At a certain point, lower prices draw in the "fundamental" buyers, helping to put a floor under prices.  I don't think Seattle is there yet, but, it appears some "fundamental" buyers are being drawn in.  Several large out of town home builders have made significant commitments to the Puget Sound area.

                   MDC Holdings purchased the assets of SDC staking a large position between Kent & Olympia.
                   Pulte/Centex took large positions at MPD's Snoqualmie Ridge & Redmond Ridge.
                   Newland took a stake in Cascadia.
                   Henley bought out Bennett.

Having the benefit of a longer term outllook, this outfits can wait out another year of falling prices and still make out like bandits.  In the meantime, lower prices draw in investors which is a huge step in building bottom.  Currently, lower prices have not drawn in retail home buyers suggesting that prices need to be even lower.  I'm keeping an eye on sale volumes to see the price that is required to draw in buyers.

Monday, April 25, 2011

New Home Activity

New Home Sales were reported by the Census Bureau this morning.  Sales came in at a SAAR rate of 300,000.
 The 300,000 rate is the lowest in recorded history.  The chart above (all charts from Calculated Risk) shows the dramatic cliff diving in sales since the peak in 2005.
 On a monthly basis, 29,000 homes sold.  2011 is lagging the artificially stimulated sales of 2009/10, but not by too much.
 Fortunately, Completed Inventory is nearing historic lows.  As of March, there were 73,000 finished homes on the market.  Homes under construction are at historic lows.  Permitted, but not started homes are looking very skinny.
 Months Supply is consolidating back towards "normal" levels with March coming in at 7.3 months supply.  The pullback in months supply is due more to the lack of starts (see next chart) than robust sales.
Starts have plummeted as builders play defense.  Monthly starts appear to have been around 35,000 which is slightly above March's sales.

The New Home Market continues to struggle against the Used Home Market.  Builders are still having trouble competing with all the distressed properties on the market.  New Home Inventory continues to dry up, by necessity, setting up a return to more profitable pre-sale activity for Builders.  The trick will be to come up with competitive products to match foreclosure & short sale listings on the market.  This will be difficult until more of the distressed properties are removed from the market.  Keep an eye on Existing Home Sales to see when this happens.

Friday, April 22, 2011

Equity Indices

Tumultuous week for the stock market starting with a vicious gap down Monday on S&P's downgrade of the US.  By the end of the day the markets had regained a huge chunk of the initial drop.  Strong earnings propelled the market higher by the end of the week.
 The Dow Industrials became the 1st index to hit new highs for the year.  The indicators are all pointing north.  The Dow looks to be heading to its target of 130.
 The S&P is lagging the Dow.  Will need to see a new high shortly to confirm the Dow's breakout.  Wave 3 had a nice 62% correction, while minor wave 1 had a reasonable 50% correction.  This helps confirm the wave count.  142 still looks like a reasonable target.
 The Naz 100 is also near a new 52 week high.  The index took a nice leap off the 20 & 50 day ma's during the week.  Need to see the breakout to confirm the move.

 The Mid Caps also got a lift for the week leaving them close to new highs, also.  The Mid Caps actually established a new high early in April.  Hold high and 20 day ma should provide a safe entry point with the target at 107.
 Russell 2000 also pointing higher.  The indicators are supportive for a move to 92.
The Semiconductors were launched higher by Intel during the week.  This is certainly supportive of the Naz target noted above.
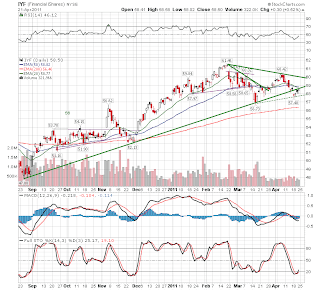
 The financials have failed to contribute much to the market this year with an approximate 0% gain (about the same return you'd get on their CD offerings).  The financials are up against their trendline with the 20 & 50 day ma's not far above.  There are better places to look for opportunity outside of the financials.
Transports are struggling with high oil prices.  They did set new highs in April, but gas prices could hinder further upside.

Should the Transports & Financials hold their own, the rest of the indices ought to proceed to their targets.

Tuesday, January 11, 2011

Home Sales

The Seattle Times reported a big increase in home sales during December, a typically slow month for closings.  Since volume needs to precede price this would be a significant step towards halting the decline in Real Estate prices.  However, one month does not a trend make.  As Seattle Bubble points out, pending sales are not showing as robust an improvement.

There is still room for closed sales to increase, but it will have to be supported by an increase in pendings.  I'll be watching this closely.

Real Estate Stocks - Update

Since my last post, it appears the market continues to believe Real Estate is moving up off the bottom.

The HomeBuilder index hit its target of $18 and now has a couple of tails off the high.  It may need to reset from here, but the market is certainly anticipating an improved environment for the Spring.  I hope the market is right. 

The REITS have been treading water since the Fall.
Great support remains at $53. 

Home Improvement Stocks were buoyed by strong earnings reports.

As anticipated, Home Depot challenged its May high of $36, making it to $35.57. 

10 year Treasury Rates have surged.
There doesn't seem to be any impediments to rates hitting 3.85%.  It doesn't appear to be ready to break the trendline at this time.  Will need to watch.
Banner Bank skyrocketed after it became clear they weren't going under.  The stock has launched over 40% since mid-December.  There ought to be plenty of support at $2.00, where the secondary offering went off.

Outlook 2011 - Interest Rates

Interest rates had a nice yearend rally commencing in November when QE2 was launched.

5 yr rates found a bottom in November and are destined to hit the upper trendline near 22.6.  They will need to regroup lower from there, perhaps near 18.  I expect rates to break the trendline during 2011 and forge higher.

Outlook 2011 - S&P 500

The S&P had a nice run in 2010, up nearly 13%.

After a brisk run in the Fall, the market looks overbought and in need of a pullback.  1200 looks like the most likely candidate for support.  If indeed the market does pullback, it should be bought for a vigorous rally that should ensue.  It looks to me that the S&P 500 ought to run close to 1475 before the rally would be over.  This is the blueprint I will be following until the market shows me differently.

Sunday, December 12, 2010

Pacific NW Stocks - Update

Hopefully, Pacific NW stocks continue to point towards a economic recovery in the Puget Sound Area.  Most stock have done quite well since my post in October. 

 Amazon powered ahead for another 12% run.  They are apparently winning their war on retailers.  Side beneficiaries of their victory have been the package delivers, Federal Express and UPS.  Looks overbought and in need of a price correction.

 Costco hit its target of 70 (for a 10% run), and then a funny thing happened this week.. they announced better than anticipated earnings pushing the stock higher.  Costco is also overbought, taking profits is in order.

 Starbucks exceeded its target of 32 (for a 14% run) by hitting 33 this week. 

 Nordstroms hit its target of 42 (16% increase) and decided to move a little higher.  It's currently consolidating within its base.  It looks like a better option to see where it settles out rather than buying now.

 Boeing can't seem to get out of its own way.  Delay after delay on the Dreamliner is trying investors patience.  The stock got hit with multiple downgrades after the latest announcement.  The stock has moved to the bottom of its base.  New purchases should have a stop at $63 with a new target of $70.

Weyerhaeuser almost made it to its target of $19 before getting downgraded this week.  It did make it to $18, for a 16% move.

Interest Rates

Interest rates appear to finally be making the move higher, in a big way.  In defiance of the Federal Reserve, it appears the bond vigilantes are making a stand.

 The 5 year note based out at 1.0% (1% interest to lock your money up for 5 years, that had to be some sort of joke).  5 year rates look headed to 2.3%.
The 10 year rate also bottomed in October.  Next stop is 3.8%.